With emission reduction, count what doesn’t get countedBy Alec RobertsIn total GHG emissions that can be linked to Newcastle LGA there are a large number of emissions that are not included in the total measured GHG emissions such as in the Newcastle 2020/21 municipal emissions snapshot from the Snapshot community climate tool (Ironbark Sustainability and Beyond Zero Emissions, 2022). These emissions are hard to quantify although some estimates are given below. All GHG emissions need to be reduced, not only those quantified as being Newcastle LGA emissions. Domestic Aviation and Air Freight Newcastle Airport is jointly owned by the City of Newcastle and Port Stephens Council and is in the Port Stephens LGA. Although Newcastle Airport is a regional airport, the majority of air travel to and from Newcastle Airport involves passengers originating from Newcastle LGA. However, these emissions are not included in the total for Newcastle LGA. In 2022-23 over 1 million domestic passengers flew from or to Newcastle Airport generating around 60,000 t CO2-e (BITRE,2022; 2023a; Ironbark Sustainability and Beyond Zero Emissions, 2022). Over 2.5 times the passengers are expected by 2036 (Infrastructure Australia, 2022). Newcastle Airport is currently a domestic airport but is planned to become an international airport from mid-late 2024 following an airport expansion (Newcastle Airport, 2023). Newcastle Airport intends to have direct flights to Malaysia, the Pacific Islands, New Zealand, and Singapore. These long-haul flights will increase emissions, Air freight via Newcastle Airport, although relatively small compared to Sydney Airport, is expected to increase following the airport expansion through reduced costs and travel time compared to freight via Sydney Airport. Shipping Freight International shipping freight to and from NSW accounts for 30% of transport freight emissions of approximately 1.4 Mt CO2-e (Centre for Transport Energy and Environment, New South Wales Transport, 2015 cited by TfNSW, 2018a; DCCEEW 2022c). In 2020-21 Newcastle port exported 157.8 million tonnes of product (mostly coal) and imported 4.4 million tonnes of product. Collectively, this represents approximately 85% of NSW’s International Shipping Freight w/w (NSW Total approximately 191 million tonnes) (BITRE, 2023b). Therefore the annual transport freight emissions from international shipping at Newcastle Port would be approximately 1.2 Mt CO2-e. Air Freight International air freight to and from NSW accounts for 30% of transport freight emissions of approximately 1.4 Mt CO2-e (Centre for Transport Energy and Environment, New South Wales Transport, 2015 cited by TfNSW, 2018a; DCCEEW 2022c) with the majority via Sydney Airport. The proportion of air freight to and from Newcastle via Sydney is estimated to be about 2% of NSW, which equates to emissions of approximately 30,000 t CO2-e per annum. Passenger Shipping Cruise ships emit significantly more carbon dioxide per passenger kilometer than passenger flights. At best, a holiday on a cruise ship will emit more than double the carbon dioxide per person than a holiday involving passenger flight. A 5-day holiday on one of the most efficient cruise ships would emit 500 kg CO2-e per person. A similar holiday flying instead would emit 235 kg CO2-e per person (Comer, 2022). In 2019, approximately 5% of Australians went on a cruise (Statistica, 2023a; 2023b). Assuming a similar proportion of Newcastle LGA residents took a cruise, then over 8,500 residents would have taken a holiday on a cruise ship, leading to the emission of at least 4,250 t CO2-e. International Travel - Flying An average long-haul international flight from Sydney is 1,79 t CO2-e per passenger (Travel Navigator, n.d.). Assuming Newcastle residents are equally likely to take international flights to other Australian residents, approximately 68,700 international flights were taken by Newcastle LGA residents in 2019 (Sheth, 2019). This equates to approximately 122,800 t CO2-e emissions per annum. Scope 3 Emissions Ammonium Nitrate The Kooragang Island Orica plant produces approximately 400,000 tonnes of Ammonium Nitrate for explosives each year for the mining industry (Orica. n.d.). Fertiliser is no longer produced at the Kooragang Island plant. The use of explosives in mining leads to the release of greenhouse gases, with 0.17 t CO2-e emissions per tonne of product used (Department of Climate Change, 2008). Therefore the use of Ammonium Nitrate produced at the Kooragang Island plant results in approximately 68,000 t CO2-e emissions per annum. Exported Coal Leaving the biggest for last, Newcastle Port exports around 160 million tonnes of thermal coal each year. The use of thermal coal for combustion leads to the release of greenhouse gases, with 2.51 t CO2-e emissions per tonne of product used. In 2021, a total of 156.7 million tonnes were exported (Port of Newcastle, 2023) which would result in approximately 394.4 Mt CO2-e emissions per annum. Exported Coal emissions equate to 99.6% of the emissions detailed here, by far the lion’s share. As a comparison the total Newcastle LGA measured emissions for 2020/21 are 2.113 Mt CO2-e (Ironbark Sustainability and Beyond Zero Emissions, 2022), equivalent to 0.5% of the emissions resulting from coal exports from Newcastle. Such figures underlie the importance of curtailing the export of coal from Newcastle to address effective GHG emission reduction in combating the effects of climate change. Similarly, total measured emissions for NSW are only 29% of the emissions resulting from coal exports from Newcastle. Putting it more starkly, the emissions resulting from the export of coal through Newcastle Port are roughly equivalent to the annual total measured GHG emissions for Australia (401.4 Mt CO2-e for 2020/21) (Ironbark Sustainability and Beyond Zero Emissions, 2022) (See Figure 1) . Such figures underlie the heavy importance of curtailing the export of coal from Newcastle to address effective GHG emission reduction in combating the effects of climate change. 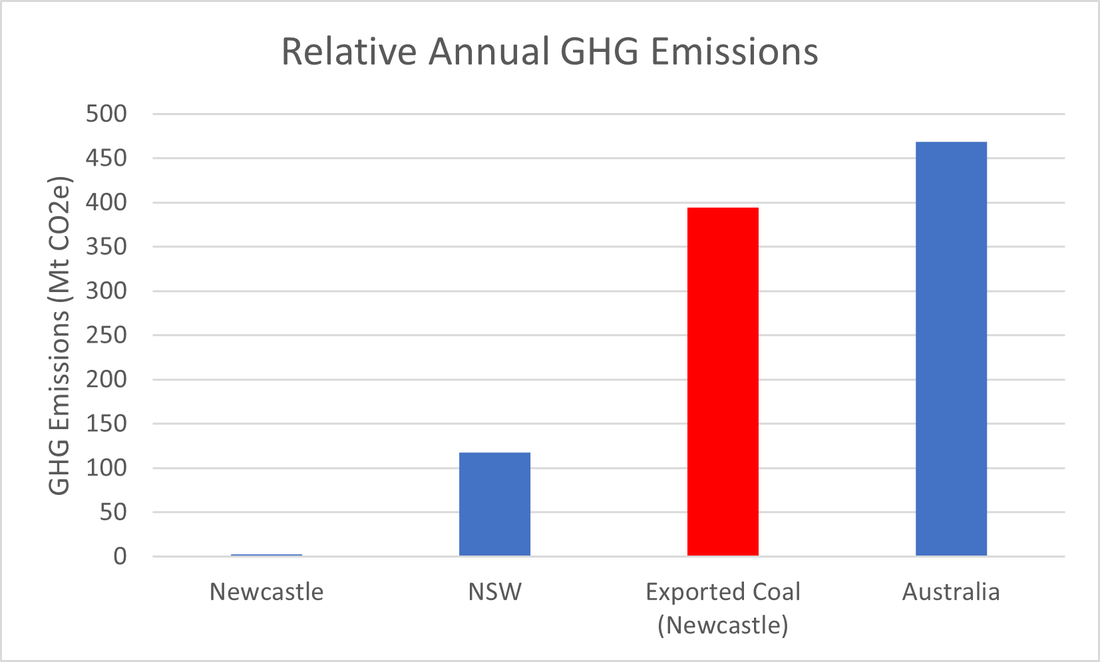 Relative Annual GHG Emissions References Australian Bureau of Statistics (ABS). (2023). Overseas Arrivals and Departures, Australia. Australian Bureau of Statistics. Retrieved 15 October 2023, from https://www.abs.gov.au/statistics/industry/tourism-and-transport/overseas-arrivals-and-departures-australia/aug-2023 Bureau of Infrastructure and Transport Research Economics (BITRE). (2023a). Monthly Airport Traffic Data for top twenty airports: January 2009 to current - March 2023. Airport traffic data. Retrieved 14 October 2023, from https://www.bitre.gov.au/publications/ongoing/airport_traffic_data Bureau of Infrastructure and Transport Research Economics (BITRE). (2023b). Australian Sea Freight 2020-21. Retrieved 14 October 2023, from https://www.bitre.gov.au/publications/2023/australian-sea-freight-2020-21 Bureau of Infrastructure and Transport Research Economics (BITRE). (2022). Airport Passenger Movements by Month - 20 major airports. Airport traffic data. Retrieved 14 October 2023, from https://data.gov.au/dataset/ds-dga-cc5d888f-5850-47f3-815d-08289b22f5a8/details Comer, B. (2022). What if I told you cruising is worse for the climate than flying? The International Council on Clean Transportation. Retrieved 15 October 2023, from https://theicct.org/marine-cruising-flying-may22/ Department of Climate Change, Energy, the Environment and Water (DCCEEW). (2022c). National Greenhouse Accounts 2020: State and Territory Greenhouse Gas Inventory, Australian Government Department of Climate Change, Energy, the Environment and Water.. Retrieved 26 March 2023, from https://www.dcceew.gov.au/climate-change/publications/national-greenhouse-accounts-2020/state-and-territory-greenhouse-gas-inventories-annual-emissions Department of Climate Change. (2008) National Greenhouse Accounts (NGA) Factors. Retrieved 16 October 2023, from http://www.globalbioenergy.org/uploads/media/0801_Australia_-_National_Greenhouse_Accounts__NGA__factors.pdf Infrastructure Australia. (2022). Newcastle airport capacity expansion. Retrieved 14 October 2023, from https://www.infrastructureaustralia.gov.au/map/newcastle-airport-capacity-expansion Ironbark Sustainability and Beyond Zero Emissions. (2022). 2022 Snapshot emissions profile – Ironbark Sustainability and Beyond Zero Emissions. Snapshot. Retrieved 09 April 2023, from https://snapshotclimate.com.au/ Newcastle Airport. (2023). Transformative terminal expansion gets underway at Newcastle Airport. Retrieved 14 October 2023, from https://www.newcastleairport.com.au/news/transformative-terminal-expansion-gets-underway-at-newcastle-airport/ ORICA. (n.d.). History. Retrieved 16 October 2023, from https://www.orica.com/Locations/Asia-Pacific/Australia/Kooragang-Island/Operations/History Port of Newcastle. (2023). Trade report 2022. Retrieved 15 October 2023, from https://www.portofnewcastle.com.au/the-port/publications/ Sheth, K. (2019). Countries That Travel The Most. WorldAtlas. Retrieved 15 October 2023, from https://www.worldatlas.com/articles/countries-whose-citizens-travel-the-most.html Statistica. (2023a). Number of global ocean cruise passengers 2009-2027. Retrieved 15 October 2023, from https://www.statista.com/statistics/385445/number-of-passengers-of-the-cruise-industry-worldwide/ Statistica. (2023b). Leading passenger source countries in the global cruise industry in 2019. Retrieved 15 October 2023, from https://www.statista.com/statistics/287114/cruise-passenger-share-by-source-country/ Transport for NSW (TfNSW). (2018a). NSW Freight and Ports Plan 2018-2023. Retrieved 09 March 2023, from https://www.transport.nsw.gov.au/projects/strategy/nsw-freight-and-ports-plan Travel Navigator. (n.d.). Carbon emissions from London to Sydney. Retrieved 15 October 2023, from https://travelnav.com/emissions-from-london-united-kingdom-to-sydney-australia
0 Comments
Leave a Reply. |
AuthorWrite something about yourself. No need to be fancy, just an overview. Archives
March 2024
Categories |
 RSS Feed